Figure 10-16 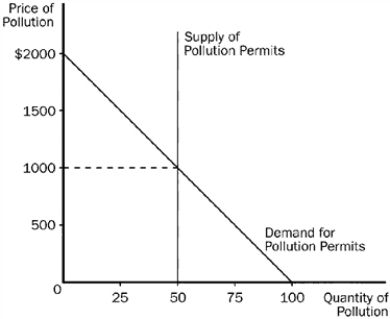
-Refer to Figure 10-16. This graph shows the market for pollution when permits are issued to firms and traded in the marketplace. The equilibrium price of pollution is
Definitions:
Required Return
The basic annual percent yield needed to appeal to individuals or businesses for investment in a specific project or security.
Cash Flows
The gross flow of cash and assets equivalent to cash moving into and away from a business operation.
Payback Period
Payback period is the amount of time it takes for an investment to generate an amount of cash flow equal to the original investment amount.
Net Cash Inflows
The amount of cash that a business receives over a period, minus the amount of cash outflows.
Q101: In class action lawsuits interested parties to
Q118: Refer to Figure 9-17.Relative to the free-trade
Q152: Refer to Scenario 9-2.Suppose the world price
Q232: The world price of a ton of
Q259: Suppose France imposes a tariff on wine
Q281: The Coase theorem asserts that private economic
Q304: In what sense do externalities cause the
Q321: Refer to Figure 11-1.Which of the following
Q366: The idea of requiring motorists to pay
Q456: When the government reduces my income tax