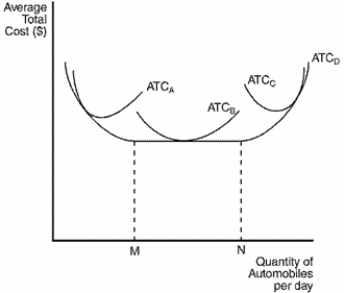
Figure 13-9
The figure below depicts average total cost functions for a firm that produces automobiles. 
-Refer to Figure 13-9. In the long run, the firm can operate on which of the following average total cost curves?
Definitions:
Materials
Substances or components used in the production or manufacturing of goods.
Mathematical Scheduling
The use of mathematical models and algorithms to plan and allocate resources effectively to tasks over time, in order to optimize productivity and efficiency.
High-Tech Nerve Centre
A centralized location equipped with advanced technological and communication tools to monitor, control, and manage operations.
Rapid Rescheduling
The quick adjustment and rearrangement of production or work schedules in response to changes in demand or supply.
Q18: The use of specialization to achieve economies
Q31: Refer to Table 14-2.For a firm operating
Q163: When adding another unit of labor leads
Q253: Which of these curves is the competitive
Q300: Refer to Table 14-6.What is the total
Q369: Refer to Figure 14-6.When market price is
Q407: Which of the following is a characteristic
Q420: A firm will shut down in the
Q455: The largest budgetary expense for a typical
Q467: Refer to Table 13-7.What is the value