Figure 21-3
In each case, the budget constraint moves from BC-1 to BC-2. 
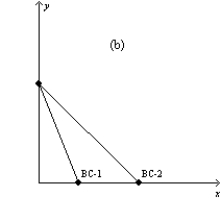
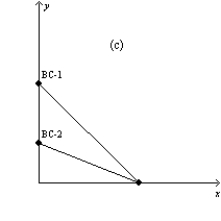
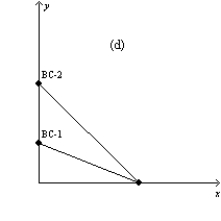
-Refer to Figure 21-3. Which of the graphs in the figure could reflect a simultaneous decrease in the price of good X and increase in the price of good Y? (i)
Graph a
(ii)
Graph b
(iii)
Graph c
(iv)
Graph d
Definitions:
Q14: Politicians often point to wage differentials as
Q84: In 2008 the top 5 percent of
Q89: In view of the possible need for
Q150: Refer to Figure 21-4.Which of the graphs
Q208: A society consists of three individuals: Arthur,Billie,and
Q231: The 2001 Nobel prize in economics was
Q269: If a government could successfully achieve the
Q377: Refer to Figure 21-6.Suppose a consumer has
Q437: Refer to Figure 21-14.Which of the graphs
Q456: Economic theory predicts that an increase in