Figure 21-2.The graph shows two budget constraints for a consumer. 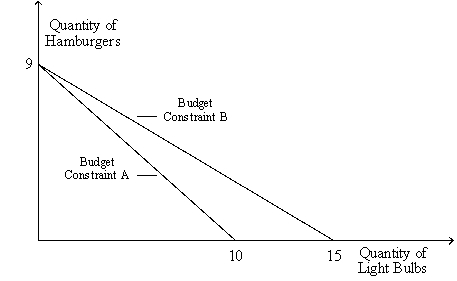
-Refer to Figure 21-2.Suppose the price of a light bulb is $3 and Budget Constraint B applies.What is the consumer's income? What is the price of a hamburger?
Definitions:
Price Change
A variation in the cost of goods or services over time, either increasing or decreasing based on market conditions.
Price Elasticity
Price elasticity measures how much the quantity demanded of a good responds to a change in its price, indicating the sensitivity of consumers to price changes.
Quantity Demanded
The total amount of a good or service that consumers are willing and able to purchase at a given price within a specified period.
Price Elasticity
A measure of how much the quantity demanded of a good responds to a change in the price of that good, with elasticity greater than one indicating a high responsiveness.
Q73: Answer the following questions based on the
Q133: The theory of consumer choice most closely
Q135: If the consumer's income and all prices
Q189: An indifference curve illustrates the<br>A) prices facing
Q276: Refer to Figure 21-7.Suppose a consumer has
Q282: The income effect of a price change
Q298: Asymmetric information,political economy,and behavioral economics<br>A) are topics
Q329: Experiments show that when real people play
Q361: If greater equality is the benefit of
Q491: Which of the following statements is correct?<br>A)