Figure: Random Allocation under Price Ceilings 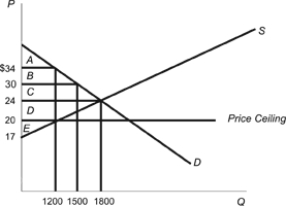
Refer to the figure. The government enacted a price ceiling of $6 per unit. Using the information provided in the graph, calculate the following:
a. If the goods are allocated randomly between the high-value uses and the low-value uses, what is the total amount of consumer surplus in dollars?
b. What is the lost amount of consumer surplus when goods are allocated randomly, when compared to a situation in which the goods are allocated only to the highest-value uses?
Definitions:
Nonrenewable Natural Resource
Things such as oil, natural gas, and metals, that are either in actual fixed supply or that renew so slowly as to be in virtual fixed supply when viewed from a human time perspective.
Timber
Wood that has been processed into beams and planks, a stage in the production of materials for building and furniture making.
Alternative Fuels
Fuels other than fossil fuels, often produced from renewable resources, used to power vehicles and machinery.
Economically Viable
Capable of generating sufficient income to cover expenses and produce a profit.
Q4: Mario buys eight units of good X
Q8: (Figure: Supply Shift 2) Refer to the
Q17: A market can be described by the
Q28: When calculating a markup based on cost,
Q33: Price floors encourage firms to provide _
Q86: Deregulation of the airline industry has led
Q150: What is blat?<br>A) a long line<br>B) the
Q169: An increase in the quantity supplied causes
Q172: Would you expect shortages due to rent
Q248: Price floors and price ceilings both result