Use the following to answer questions: Figure: Oil Market Diagrams 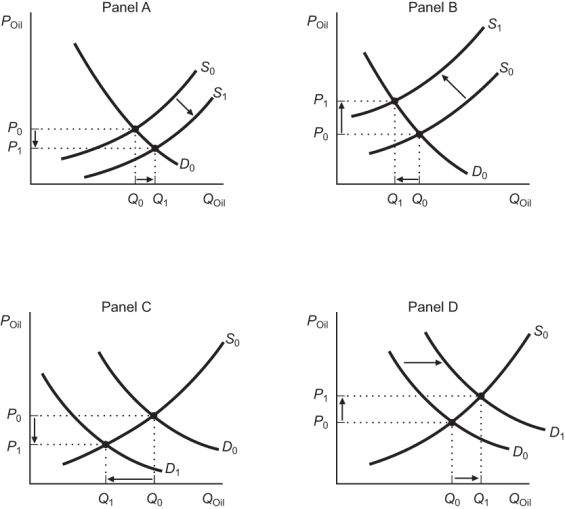
-(Figure: Oil Market Diagrams) Consider the world oil market diagrams presented in the figure. Which of the panels correctly depicts the cause of rises in the price of oil in the early 2000s?
Definitions:
Q78: During a recession, higher labor adjustment costs
Q80: Individuals who are "underwater" in their home
Q96: If your university decides to build five
Q151: In the long run, money:<br>A) always increases
Q158: When the U.S. Treasury borrows, the borrowing
Q158: The natural unemployment rate is the sum
Q191: Graphically, a positive real shock causes a
Q208: Suppose a restaurant moves to another city
Q221: Changes in <span class="ql-formula" data-value="\vec
Q247: Which of the following is a real