Figure: Price Changes 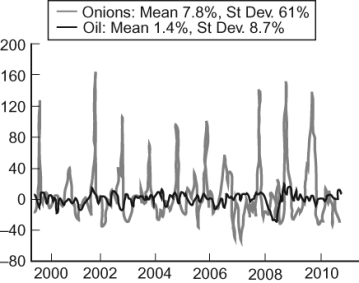 The figure (from Global Financial Data, EIA) illustrates in percentage terms how the price of onions (in gray) and crude oil (in black) fluctuate over time. The price of onions clearly fluctuates more than oil. In 1958, the United States Congress banned future markets on onions. How does this historical fact explain the difference in deviation between oil and onions?
Definitions:
World Bank
An organization established by the industrialized nations in 1946 to loan money to underdeveloped and developing countries; formally known as the International Bank for Reconstruction and Development.
Underdeveloped
Refers to countries or regions with low levels of industrialization, infrastructure, and income per capita compared to other countries.
Q24: The statement that "price controls do not
Q35: (Figure: Price Ceiling) Refer to the figure.
Q47: Imagine the existence of prediction markets for
Q54: A wage subsidy would:<br>A) decrease the demand
Q69: Which would be the least likely result
Q86: Many times after natural disasters such as
Q104: Using a supply and demand diagram as
Q107: On average, the gain in value from
Q162: If the futures price is much higher
Q195: The Iowa Electronic Markets:<br>A) predicted that Obama