Figure: Supply-Driven Price Change 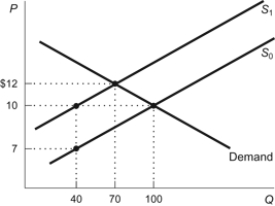 Refer to the figure. When the supply curve shifts from S0 to S1, the equilibrium price rises to:
Definitions:
Penalty
A punishment imposed for breaking a law, rule, or contract, which often involves paying a fine or forfeiting something.
Mark-Up
The amount added to the cost of a product or service to cover overhead and profit.
Selling Price
The amount of money for which a product is sold to the customer, after accounting for discounts, rebates, and other adjustments.
Payment
The transfer of money, or its equivalent, from one party to another in exchange for goods, services, or to fulfill a legal obligation.
Q20: (Figure: Gun Market) In the gun market
Q39: (Figure: Water and Electricity) Refer to the
Q52: Economic theory suggests that permanent gun buyback
Q91: The demand curve has a negative slope.
Q96: (Figure: Chocolate) If the price in the
Q105: The supply of ancient Egyptian papyrus manuscripts
Q136: Why does supply slope up?<br>A) At higher
Q214: Which of the following would NOT lead
Q238: To examine how responsive consumers are to
Q250: Figure: Elasticity and Quantity Demanded <img src="https://d2lvgg3v3hfg70.cloudfront.net/TB33781/.jpg"