Figure: Demand Curve 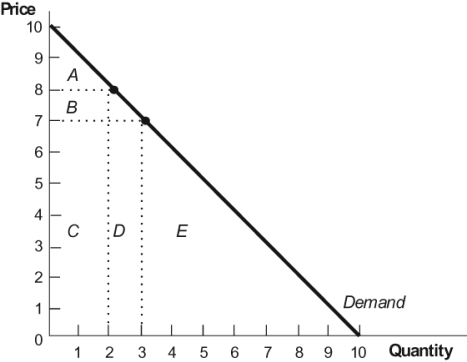 In this figure, the marginal revenue of the third unit is given by area:
Definitions:
Price Elastic
Price Elasticity measures the responsiveness of the quantity demanded or supplied of a good to a change in its price, indicating the sensitivity of consumers or producers to price changes.
Tax Revenue
The revenue that governments acquire from taxes.
Unhealthy Fast Food
Quick-service food options that are typically high in calories, fats, sugars, and sodium, contributing to poor dietary habits and health.
Inelastic Demand
A situation where the demand for a product changes very little when its price changes, indicating that consumers still purchase the product at nearly the same rate regardless of price fluctuations.
Q26: California's "perfect storm," following the deregulation of
Q35: Entrepreneurs have the incentive to:<br>A) follow the
Q38: Which of the following statements is TRUE?<br>I.
Q59: If Tom sells 500 sandwiches for $7
Q122: Gillette's practice of selling razors at a
Q138: When cartels are successful at driving up
Q140: Stating that marginal revenue equals price is
Q147: Price discrimination may be:<br>A) good in industries
Q238: To maximize profit GlaxoSmithKline sets a higher
Q241: Microsoft Word and Microsoft Excel are typically:<br>A)