Multiple Choice
Exhibit 8-2 Total revenue and total cost graph 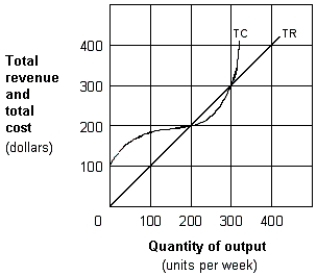
-In Exhibit 8-2, if output is 200 units per week, economic profit for the firm is:
Definitions:
Related Questions
Q22: The kinked demand curve:<br>A) applies when competitors
Q31: Examples of nonprice competition include advertising and
Q40: The demand curve any monopolist uses in
Q46: In Exhibit 8-13, if the price is
Q89: Compared to a perfectly competitive firm with
Q94: A monopoly will be maximizing profits if
Q108: A profit-maximizing monopolist will continue expanding output
Q124: As shown in Exhibit 6-3, assume that
Q191: As shown in Exhibit 8-12, if the
Q232: The ability of a good to satisfy