Exhibit 4-3 Supply and demand curves 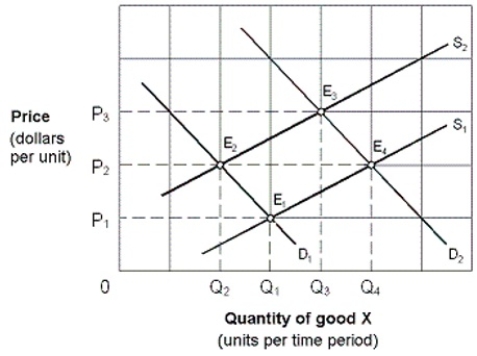
-Initially the market shown in Exhibit 4-3 is in equilibrium at P2, Q2 (E2) . Changes in market conditions result in a new equilibrium at P2, Q4 (E4) . This change is stated as a(n) :
Definitions:
Cost Of Capital
The rate of return a company must earn on its investment to maintain its market value and attract funds. It represents the cost of a company to secure funds, whether through debt or equity.
Capital Component
One of three sources of capital: debt, preferred stock, or equity.
Required By Investors
Refers to the expectations or conditions that investors demand before committing capital to an investment.
Capital Structure
The combination of borrowing and ownership investments utilized by a company to finance its activities and expansion.
Q35: The price elasticity of demand coefficient for
Q57: The more elastic the supply of a
Q58: Other factors held constant, if there are
Q114: The slope of an indifference curve is
Q118: Which of the following is an example
Q171: Assume that Coca-Cola and Pepsi-Cola are substitutes.
Q190: If the equilibrium price of bread is
Q214: Which of the following is a public
Q223: Which of the following are not methods
Q231: If tofu is a normal good, an