Multiple Choice
Exhibit 4-3 Supply and demand curves 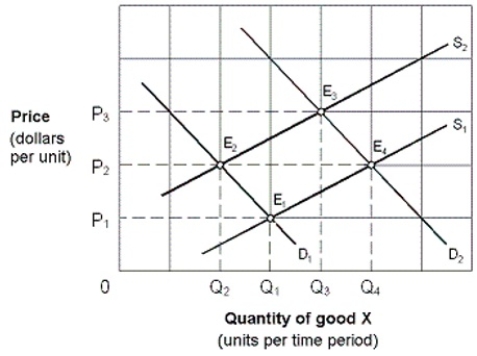
-Initially the market shown in Exhibit 4-3 is in equilibrium at P3, Q3 (E3) . Changes in market conditions result in a new equilibrium at P2, Q2 (E2) . This change is stated as a:
Definitions:
Related Questions
Q12: As price decreases and we move down
Q30: Sally recently got a 15 percent raise.
Q83: If the equilibrium price of good X
Q90: If a 10 percent cut in price
Q116: Consumer equilibrium exists when:<br>A) the marginal utility
Q135: An increase in the demand for tattoos
Q135: Assuming compact discs and cassettes are substitute
Q180: As shown in Exhibit 6A-6, the marginal
Q199: Which of the following best represents the
Q221: The slope of the indifference curve for