Multiple Choice
Exhibit 3A-2 Comparison of Market Efficiency and Deadweight Loss 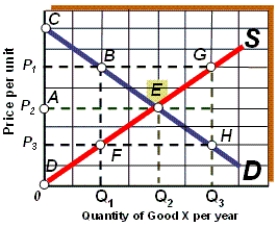
-As shown in Exhibit 3A-2, if the quantity supplied of good X per year is Q1, the result is a deadweight loss represented by area:
Definitions:
Related Questions
Q6: The production possibilities curve illustrates all of
Q23: An inverse relationship exists when:<br>A) there is
Q55: Human wants:<br>A) are unfilled only in the
Q56: What is scarcity and why does it
Q82: The branch of economics that focuses on
Q122: Producer surplus measures the value between the
Q130: Which would be least likely to cause
Q160: In Exhibit 2-15, inefficient resource use is
Q177: Suppose A and B are complementary goods.
Q376: The points along the supply curve represent