Exhibit 3-3 Demand curves 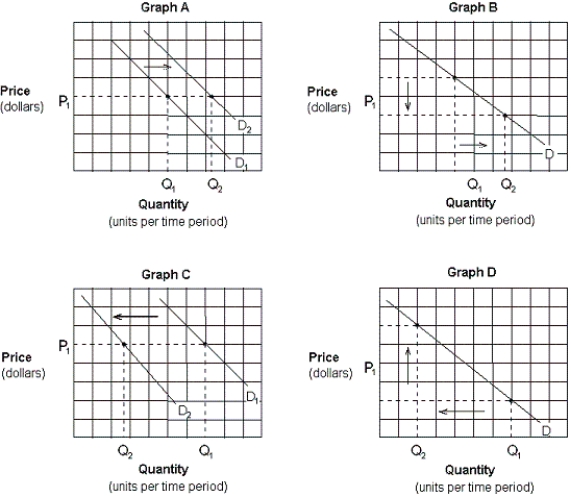
-Assume that consumers expect the price of gasoline to rise sharply in the future. Which of the graphs in Exhibit 3-3 depicts this effect?
Definitions:
Marginal Social Benefit
The additional benefit to society from consuming or producing one more unit of a good or service.
Marginal Social Cost
Marginal social cost is the total cost to society of producing one additional unit of a good or service, including both private costs and any externalities.
Common Resources
Resources that are accessible to all members of a society but are limited in availability and can be depleted by overuse.
Private Markets
Markets where transactions occur between private entities without significant government intervention, focusing on the exchange of goods and services among individuals and businesses.
Q5: The opportunity cost of an action is:<br>A)
Q41: Exhibit 3-8 presents supply and demand data
Q49: The condition of scarcity:<br>A) cannot be eliminated.<br>B)
Q61: Complementary goods are goods:<br>A) that are consumed
Q78: City streets, sewage systems, and police protection
Q99: Demand curves are negatively sloped when people
Q118: Which of the following is an example
Q139: When making a rational decision which requires
Q173: An increase in the expected future price
Q317: Using supply and demand curve analysis, the