Assume that that the two graphs below are identical demand curves for hamburger. The only difference is that the one on the left measures hamburger in pounds and the one on the right measures hamburger in ounces. The elasticity of demand between the prices of $3 and $2 should be the same in both cases. However, prove that calculating the slopes between these two points on each graph would not be helpful in determining elasticity of demand. 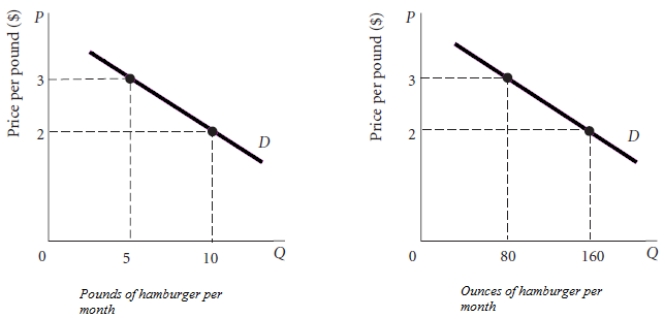
Definitions:
Central Challenge
The primary or most significant problem faced by an individual, organization, or system at any given time.
Big Picture
An overall perspective or an understanding of the broader aspects of a situation, rather than focusing on details.
Acquisition
The process by which a company purchases another company or its assets, in order to expand its operations or capabilities.
Product Line
A group of related products manufactured or sold by a single company, often sharing common attributes or targeted at a specific market segment.
Q1: Draw a hypothetical example of the demand
Q18: Suppose that macaroni and cheese is an
Q29: The Valhalla Company manufactures small lamps
Q31: What does the investment demand curve show?
Q31: Suppose that the price of capital falls.
Q37: A firm purchasing labor in a competitive
Q38: List two things that can cause the
Q50: What functions does capital income serve in
Q92: From the foregoing information, determine the amount
Q101: Calculate the total factory overhead to be