Use the following to answer question:
Figure 7.14 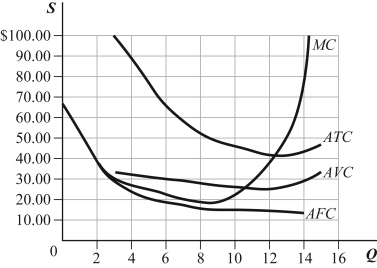
-(Figure 7.14) Refer to the graph. Do you agree or disagree with the following statement? Why? "If the firm can sell its product for $30 and it's selling 12 units, it should close its doors and produce nothing, since it is losing money."
Definitions:
Price Elasticity of Demand
measures how much the quantity demanded of a good responds to a change in the price of that good, quantified as the percentage change in quantity demanded divided by the percentage change in price.
Quantity Demanded
The total amount of a good or service that consumers are willing and able to purchase at a specific price, holding all else constant.
Linear Demand Curve
A graphical representation of the relationship between the price of a good and the quantity demanded, where the curve is a straight line.
Maximizing Total Revenue
The process of adjusting prices and output to achieve the greatest possible sales income.
Q6: Which of the following statements is (are)
Q7: Which of the following is a component
Q16: (Figure 4.9) Suppose that the consumer moves
Q22: (Figure 5.27) Illustrate the substitution effect and
Q57: A street vendor's annual license fee was
Q69: Suppose that the market for ice cream
Q72: Long-run marginal cost is:<br>A) the derivative of
Q77: Suppose the demand for good X shifts
Q94: (Figure 6.3) Which of the following statements
Q103: Monroe consumes crab cakes and tuna. Monroe's