The figure below shows the isocost lines and the isoquant map for a firm producing golf tees. 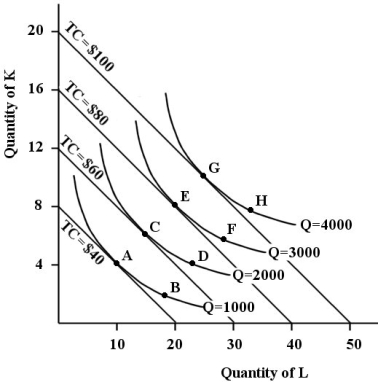 FIGURE 8- 6
-Refer to Figure 8- 6. Suppose the firm is currently producing at point E and the prices of capital and labour each increase by 30 percent. If the firm wants to minimize the cost of producing the same level of output, the firm's chosen factor combination would be at point
Definitions:
Supply Curve
A graphical representation showing the relationship between the price of a good or service and the quantity of that good or service that suppliers are willing to offer for sale at that price.
Demand Curve
Represents the relationship between the quantity of a good that consumers are willing and able to purchase and the price of that good.
Equilibrium Price
The rate at which the demand for a good or service matches its supply, creating a state of market equilibrium.
Producer Surplus
The gap between what sellers are willing and able to accept for a good and the actual price they get because of the market conditions.
Q3: An improvement in the technology used to
Q4: The statement that introducing a policy of
Q9: Each point on a demand curve shows
Q44: Find all the rational zeros of the
Q49: A perfectly competitive firm maximizes its profits
Q52: Determine the equations of the vertical and
Q53: For any firm operating in any market
Q76: In indifference curve analysis, the consumer's utility-maximizing
Q92: Suppose Statistics canada reports that total income
Q95: An index number expresses the value of