The diagram below shows the demand and supply curves in a perfectly competitive market. 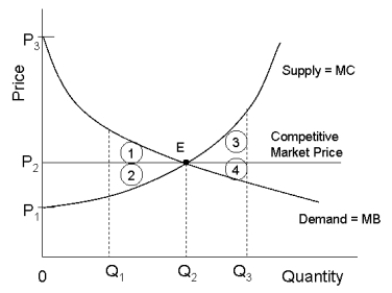 FIGURE 12-5
-Refer to Figure 12-5. If output in this market were Q₁, but the price was still at its free-market level, the loss in consumer surplus relative to the competitive equilibrium would be illustrated by area
Definitions:
Q16: Refer to Figure 10-5. Assume this pharmaceutical
Q32: We can expect that the income elasticity
Q35: The amount of uncollectible accounts at the
Q35: If a perfectly competitive industry was suddenly
Q36: The marginal rate of substitution measures the
Q41: Suppose fire destroy many millions of hectares
Q57: If all firms are profit maximizers, then
Q72: Since there is a relatively plentiful supply
Q118: If the company sells the machine at
Q128: IBM signs an agreement to lend one