True/False
Given below is the scatter plot of the number of employees and the total revenue ($millions)of 20 U.S.companies.Companies that have higher numbers of employees appear to also have higher total revenue. 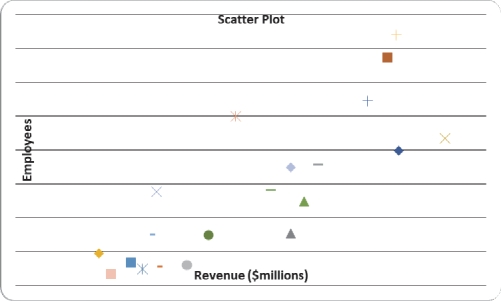
Definitions:
Related Questions
Q7: Referring to Scenario 2-4,what percentage of the
Q25: It is essential that each class grouping
Q59: Given below is the scatter plot of
Q90: In constructing a polygon,each class grouping is
Q108: Referring to Scenario 5-8,what is the standard
Q123: A manufacturer of flashlight batteries took a
Q127: The number of power outages at a
Q147: Referring to Scenario 2-14,if the sample is
Q151: A Walmart store in a small town
Q215: Referring to Scenario 5-7,if you can invest