SCENARIO 14-17
Given below are results from the regression analysis where the dependent variable is the number of weeks a worker is unemployed due to a layoff (Unemploy)and the independent variables are the age of the worker (Age)and a dummy variable for management position (Manager: 1 = yes,0 = no).
The results of the regression analysis are given below: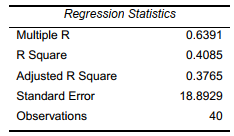
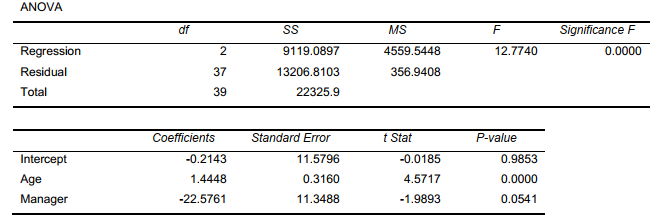
-Referring to Scenario 14-17,the null hypothesis should be rejected at a 10% level of significance when testing whether age has any effect on the number of weeks a worker is unemployed due to a layoff while holding constant the effect of the other independent variable.
Definitions:
Positive Forecast Value
The expected positive outcome or prediction in forecasting, indicating beneficial future conditions or results.
Forecast Chart
A Forecast Chart is a graphical representation used to visualize predictions about future data points, often based on historical data and analysis techniques.
Probability
The quantification of how likely an event is to happen, measured on a scale from 0 to 1.
Market Size
An estimate of the total demand for a product or service within a particular market.
Q5: Referring to Scenario 16-11,based on the parsimony
Q41: Referring to Scenario 13-3,the standard error of
Q86: Referring to Scenario 17-7,Middle East & Africa
Q88: MAD is the summation of the residuals
Q90: In k-means clustering,observations that are assigned to
Q102: Referring to Scenario 18-1,suppose the builder wants
Q145: Referring to Scenario 13-7,to test whether the
Q158: Referring to Scenario 13-10,what are the values
Q170: Referring to Scenario 13-12,there is no evidence
Q233: Referring to Scenario 14-4,which of the following