SCENARIO 17-3
The tree diagram below shows the results of the classification tree model that has been constructed to predict the probability of a cable company's customers who will switch ("Yes" or "No")into its bundled program offering based on the price ($30,$40,$50,$60)and whether the customer spends more than 5 hours a day watching TV ("Yes" or "No")using the data set of 100 customers collected from a survey.

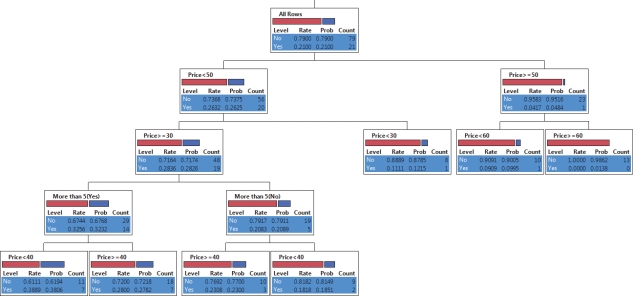
-Referring to Scenario 17-3,the highest probability of switching is predicted to occur among customers who watch more than 5 hours of TV a day and are offered the bundled price of lower than $50.
Definitions:
Q8: Referring to Scenario 19-1,which expression best characterizes
Q14: Referring to Scenario 17-7,what are the first
Q24: The logistic regression equation predicts:<br>A)The probability of
Q29: A quality control manager at a plant
Q44: Referring to Scenario 15-6,the model that includes
Q48: Referring to Scenario 14-10,the proportion of the
Q54: A microeconomist wants to determine how corporate
Q66: Which of the following is a method
Q150: Which of the following is NOT used
Q157: Referring to Scenario 18-9,the 0 to 60