SCENARIO 17-1
The table below contains the sparklines for the rates of return (in percentage)for three different stocks from 2007 to 2013.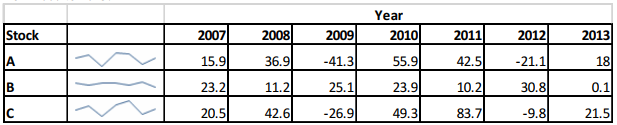
-Referring to Scenario 17-1,the sparklines enable you to predict that the rates of return of the stock market in 2014 will be higher than in 2013.
Definitions:
Residuals
The differences between observed values and the values predicted by a statistical model, indicating the model's accuracy.
Fitted Values
Predicted values calculated from a model that represent the estimated response given the predictors.
Simple Linear Regression
A statistical method that models the relationship between two variables by fitting a linear equation to observed data.
Confidence Interval
An estimate of an interval in statistics that likely contains a population parameter, providing a range of plausible values for that parameter.
Q63: A certain type of rare gem serves
Q76: Referring to Scenario 14-5,what are the predicted
Q102: The manager of a company believed that
Q104: Referring to Scenario 17-4,the highest mean weekend
Q127: If the percentage differences between consecutive values
Q132: Referring to Scenario 19-3,suppose the analyst constructs
Q174: Referring to Scenario 14-5,what fraction of the
Q180: Referring to Scenario 14-7,the department head
Q197: Referring to Scenario 18-10 Model 1,_of the
Q198: Referring to Scenario 18-10 Model 1,which