SCENARIO 19-3
A quality control analyst for a light bulb manufacturer is concerned that the time it takes to produce a batch of light bulbs is too erratic.Accordingly,the analyst randomly surveys 10 production periods each day for 14 days and records the sample mean and range for each day.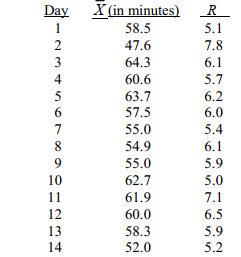
-Referring to Scenario 19-3,suppose the analyst constructs an x̄ chart to see if the production process is in-control.What is the center line for this chart?
Definitions:
Knowledge Management
The method of generating, distributing, utilizing, and controlling an organization's knowledge and information to improve its efficiency and competitive edge.
Data
Raw facts and observations.
Information
Data made useful for decision-making.
Understandability
The ease with which information can be comprehended by the receiver, often influenced by clarity, simplicity, and organization.
Q13: Referring to Scenario 20-6,what is the return-to-risk
Q20: Referring to Scenario 18-10 and using both
Q49: Total Production Maintenance is among the tools
Q52: Referring to Scenario 12-20,the parameter of interest
Q101: If the number of blocks in the
Q131: Referring to Scenario 19-8,an x̄ chart is
Q160: Referring to Scenario 18-8,what is the standard
Q240: Referring to Scenario 18-9,the error appears to
Q309: Suppose that past history shows that 60%
Q320: Referring to Scenario 18-9,what is the correct