Sketch the graph and find the area of the region bounded by the graph of the function f and lines y = 0, x = a and x = b. 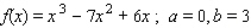
Definitions:
Machine Setups
The process of preparing and adjusting machines for a specific production run.
Fixed Manufacturing Cost
Costs that do not change with the level of production, such as salaries of permanent staff and rent for factory space.
Production Volume
The total quantity of products manufactured during a specific period.
Fixed Component
A cost or value that remains unchanged regardless of the level of output or activity, such as rent or salaried wages.
Q45: Use the table of integrals to find
Q47: The growth rate of the bacterium, a
Q114: Find the indefinite integral. <img src="https://d2lvgg3v3hfg70.cloudfront.net/TB7866/.jpg" alt="Find
Q120: Maximize the function <img src="https://d2lvgg3v3hfg70.cloudfront.net/TB7866/.jpg" alt="Maximize the
Q148: Find an equation of the tangent line
Q148: Find the indefinite integral. <img src="https://d2lvgg3v3hfg70.cloudfront.net/TB7866/.jpg" alt="Find
Q149: A building in the shape of a
Q204: Find the indefinite integral.Hint: Let <img src="https://d2lvgg3v3hfg70.cloudfront.net/TB7866/.jpg"
Q205: Evaluate the definite integral. <img src="https://d2lvgg3v3hfg70.cloudfront.net/TB7866/.jpg" alt="Evaluate
Q231: A firm purchased a 16-year franchise for