The figure given below represents the effects in the labor markets due to migration. Here the world has been divided into a high-income "North" (left panel) and a low-income "South" (right panel) . Dn and Sn are the labor demand and the labor supply curves in North. Ds and (Sr + Smig) are the labor demand and pre-migration labor supply curves in South. Sr is the post-migration labor supply curve in South. The value c is the cost of migrating. 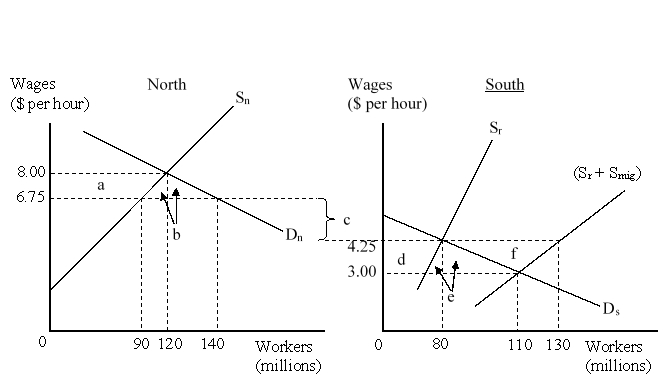 When migration is not allowed, workers in North earn _____ per hour and workers in South earn _____ per hour.
Definitions:
Beef
Meat derived from cattle, recognized for its nutritional value and used in various cuisines worldwide.
Equilibrium Price
The cost at which the amount of a product or service sought by consumers matches the amount available from suppliers.
Equilibrium Quantity
At the market equilibrium price, the amount of goods or services provided matches the amount that is demanded.
Substitutes
Goods or services that can replace each other in usage, such that an increase in the price of one leads to an increase in demand for the other.
Q1: A bank deposit in Germany denominated in
Q4: The figure given below shows a shift
Q11: A small country is considering imposing
Q19: In your opinion do government policies to
Q19: A multinational enterprise produces a component in
Q30: Firms that are engaging in persistent dumping
Q31: The asset market approach seeks to explain
Q34: Government officials wanting to defend a fixed
Q37: If markets are competitive, policies that restrict
Q50: At free-trade prices, a bicycle in country