The figure given below represents the effects in the labor markets due to migration. Here the world has been divided into a high-income "North" (left panel) and a low-income "South" (right panel) . Dn and Sn are the labor demand and the labor supply curves in North. Ds and (Sr + Smig) are the labor demand and pre-migration labor supply curves in South. Sr is the post-migration labor supply curve in South. The value c is the cost of migrating. 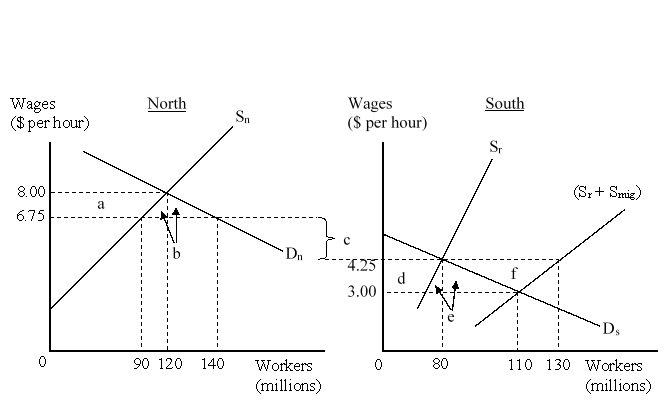 The net gain to the migrants is represented by the area:
Definitions:
Kilobyte
A unit of digital information that comprises 1,024 bytes, often used to express the size of small files or amounts of data.
Binary Digit
The smallest unit of data in computing, represented by a 0 or 1, used in the binary number system.
Bits
The smallest unit of data in a computer, representing a single binary value, either 0 or 1, which can be used to represent a state, value, or part of a code.
Letter
A written, typed, or printed communication, sent by post or messenger.
Q5: The difference between a country's purchases of
Q8: A debit item in the balance of
Q18: The current world exchange rate system is
Q18: Exchange rates are equalized in different locations
Q18: The _ exchange rate is the market
Q21: Which of the following is the least
Q29: Which of the following is a major
Q31: At points above the IS curve, there
Q55: The figure given below shows the market
Q58: Which of the following transactions is recorded