The figure given below represents the effects in the labor markets due to migration. Here the world has been divided into a high-income "North" (left panel) and a low-income "South" (right panel) . Dn and Sn are the labor demand and the labor supply curves in North. Ds and (Sr + Smig) are the labor demand and pre-migration labor supply curves in South. Sr is the post-migration labor supply curve in South. The value c is the cost of migrating. 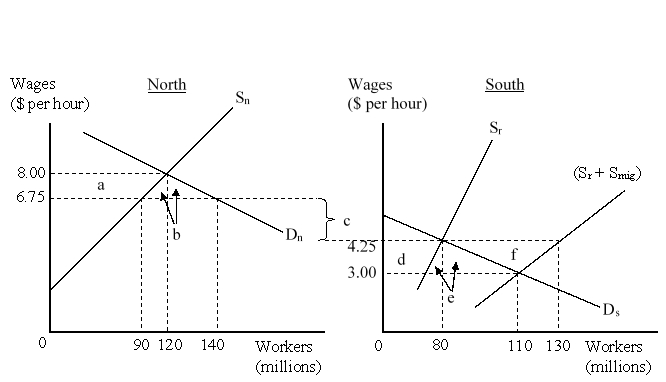 When migration between North and South is allowed, how many workers will choose to migrate to North?
Definitions:
Par Value
Is the face value of a bond or stock, representing the amount that will be returned to the investor at maturity or the value at which the stock is noted on the balance sheet.
Default Risk Premiums
The additional yield that investors demand for holding a bond that has a risk of default over a risk-free security.
Treasury Bond
A long-term, interest-bearing security issued by the government, with a maturity period typically longer than ten years.
Q4: If a currency is at a forward
Q12: The government policy dictating that all foreign
Q13: A negative externality is said to exist
Q15: Gains from joining a trade bloc will
Q16: The _ approach to exchange rates emphasizes
Q18: Which of the following is likely to
Q50: Studies comparing growth rates of countries practicing
Q51: An increase in capital inflows in the
Q55: The figure below shows an IS-LM-FE model
Q58: The revenue earned by the government in