The figure given below represents the effects in the labor markets due to migration. Here the world has been divided into a high-income "North" (left panel) and a low-income "South" (right panel) . Dn and Sn are the labor demand and the labor supply curves in North. Ds and (Sr + Smig) are the labor demand and pre-migration labor supply curves in South. Sr is the post-migration labor supply curve in South. The value c is the cost of migrating. 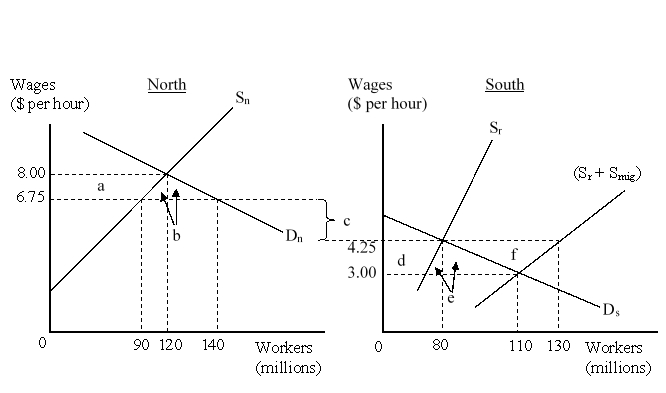 After migration of the workers, the workers in North earn _____ per hour and South workers earn _____ per hour.
Definitions:
Transmission
The act of conveying or spreading something from one place, person, or thing to another.
Infectious Chancre
A painless ulcer, typically acquired through sexual contact, that is a primary symptom of syphilis.
Syphilis
A sexually transmitted bacterial infection caused by Treponema pallidum, which can present in various stages and cause long-term complications if not treated.
Chlamydia
A common sexually transmitted infection (STI) caused by the bacterium Chlamydia trachomatis, often asymptomatic.
Q4: A nation's international investment position shows its
Q5: It is generally the case that imposing
Q15: Fixed exchange rates are likely to be
Q22: Evidence shows that governments usually impose the
Q26: In the case in which foreign affiliates
Q33: Which of the following refers to trade
Q33: In a nation's balance of payments, which
Q35: Which of the following is NOT true
Q40: A moral hazard arises when:<br>A)risk averse individuals
Q55: The figure given below shows the market