The figure given below shows the U.S. market for imported wine. For simplicity, we consider export supply curves to be flat. Chilean wine is available for $480 per barrel and French wine is available for $420 per barrel. 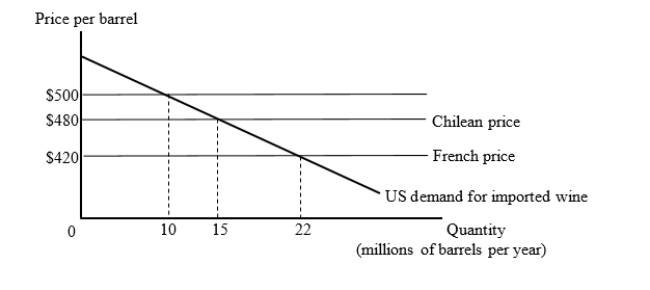 Suppose the United States has a tariff of $80 per barrel on imported wine. Then, the United States joins a trade bloc with Chile. Calculate the loss suffered by the U.S. arising from the shift of trade from low-cost exporters to higher-cost bloc-partner exporter.
Definitions:
Standard Deviation
A measure of the amount of variation or dispersion of a set of values, commonly used in finance to quantify the risk associated with a given investment.
Perfectly Negatively Correlated
A situation in which two variables move in opposite directions with a correlation coefficient of -1, implying that when one variable increases, the other decreases.
Risk-Free Portfolio
An investment group that is considered to have no risk of financial loss, typically represented by government bonds.
Expected Rate
The return that an investor anticipates or forecasts receiving on an investment over a set period.
Q5: The table given below shows the
Q22: Suppose the amount of exports of textile
Q22: Suppose the interest rate on 6-month treasury
Q24: Changing property rights as a way to
Q26: Exploiting substantial scale economies is an explanation
Q28: What elements does a solution to excessive
Q36: If trade is consistent with the H-O
Q39: The figure given below shows the national
Q41: Other things equal, the domestic currency _
Q57: Which of the following would tend to