The figure given below shows the market for MP3 players in a small country. Dd and Sd are the domestic demand and domestic supply curves of the MP3 players before the imposition of the quota. (Sd + QQ) is the total available domestic supply curve after the quota has been imposed. How many MP3 players can be imported from abroad after the quota is imposed? 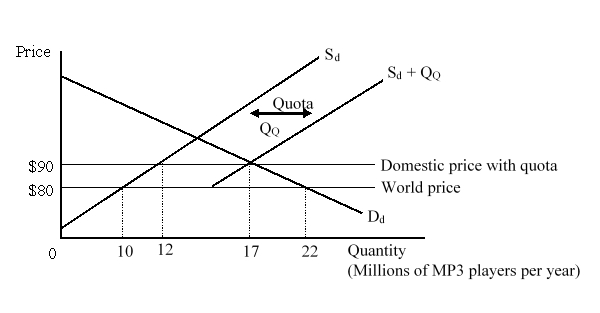
Definitions:
Q4: A bottle of wine can be produced
Q4: Industrialized countries are often alleged to discriminate
Q4: If natural gas produced in the U.S.
Q9: Which of the following is true of
Q12: A mortgage-backed security is a debt instrument
Q17: Suppose country A produces two goods, good
Q40: What are NTBs? Discuss any three forms
Q42: Which of the following is NOT among
Q43: The Stolper-Samuelson theorem indicates that given certain
Q49: When free trade begins, producers in the