The figure given below shows the market for MP3 players in a small country. Dd and Sd are the domestic demand and domestic supply curves of the MP3 players before the imposition of the quota. (Sd + QQ) is the total available domestic supply curve after the quota has been imposed. The quota on MP3 players will cause domestic producers to: 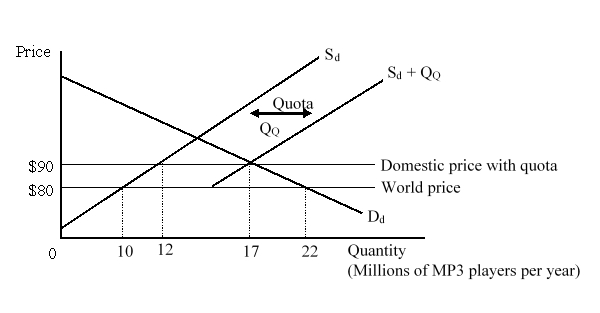
Definitions:
Q10: Suppose good X is a substitute of
Q11: The formation of a trade bloc necessarily
Q18: Exchange rates are equalized in different locations
Q18: Speculating in a position exposed to exchange-rate
Q19: Which of the following indicates the difference
Q22: In a "first-best" world:<br>A)each economy is self-sufficient
Q33: In a nation's balance of payments, which
Q43: If country X has higher labor productivity
Q51: The nationally optimal tariff is the tariff
Q57: Members of a free trade area not