Multiple Choice
The figure given below shows the market for shoes in the U.S. The domestic price line with tariff lies above the international price line. Dd and Sd are the domestic demand and supply curves of shoes respectively. 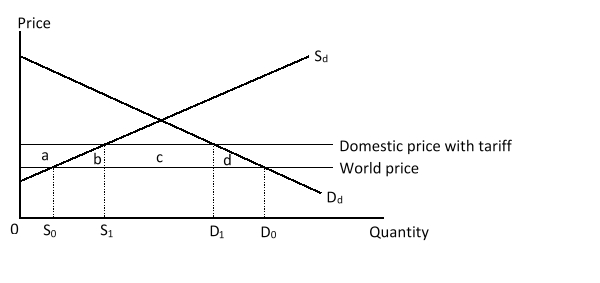 The tariff revenue of the U.S. government is shown by area _____.
Definitions:
Related Questions
Q1: Fracking has proven to have minimal environmental
Q2: You are provided with the following
Q3: A small country is considering imposing
Q6: Which of the following is true of
Q13: An indifference curve shows the various consumption
Q13: Country A is relatively land-abundant and wheat
Q18: Suppose country A, a labor-abundant country, produces
Q21: If Social Marginal Cost (SMC) > Price
Q43: In international trade jargon, an economy is
Q51: The role of international _ is to