The figure given below shows the market for shoes in the U.S. The domestic price line with tariff lies above the international price line. Dd and Sd are the domestic demand and supply curves of shoes respectively. 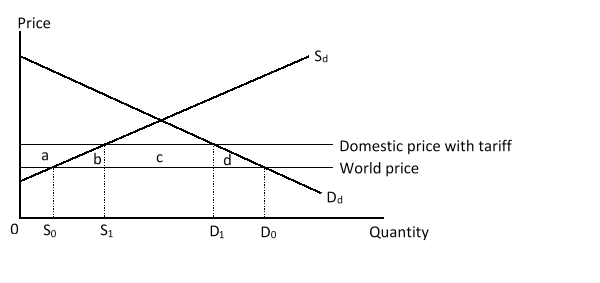 The production effect of the tariff on shoes is measured by the area _____.
Definitions:
Q12: A tariff imposed by a small country
Q15: According to the Stolper-Samuelson theorem, a price
Q17: What was the basis of the financial
Q30: Which of following is most likely to
Q30: Which of the following is an expected
Q34: If a small country imposes a tariff
Q36: The specificity rule states that:<br>A)The government should
Q37: _ suggests that with an increase in
Q41: The sum of all of the debit
Q41: Increasing-cost production-possibility curves are bowed out from