The test scores for selected samples of sociology students who took the course from three different instructors are shown below. 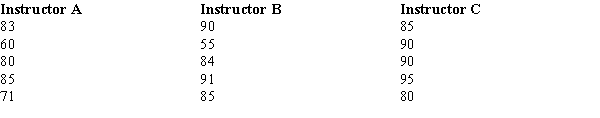
At α = .05, test to see if there is a significant difference among the averages of the three groups. Use both the critical value and p-value approaches.
Definitions:
Q3: A random sample of 100 people was
Q32: Consider the following ANOVA table. <img
Q33: A graphic presentation of the expected gain
Q41: Two approaches to drawing a conclusion in
Q48: In a regression analysis, the standard error
Q83: In multiple regression analysis, the correlation among
Q87: How many simple random samples of size
Q97: The following information regarding a dependent variable
Q101: If the coefficient of determination is .95,
Q103: Which of the following attributes or dimensions