Data extracted from the accounting information system of Turner Corporation produced the following graph. The equation of the dashed line is y = $25x; the equation of the solid line is y = $200 + $5x. 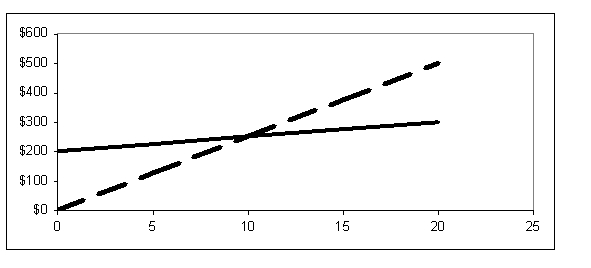 The horizontal ("x") axis shows:
Definitions:
Income Statement
A financial statement that shows a company's revenues, expenses, and net income over a specific period of time.
Sales
The total amount of revenue generated by a company from the sale of goods or services before any expenses are deducted.
Percent Change
A mathematical calculation that indicates the degree of change over time, expressed as a percentage.
Fees Earned
Revenue recognized by a company for services provided to clients, recorded as earned income on the income statement.
Q8: After a company exceeds the breakeven point:<br>A)
Q9: Job costing is used to:<br>A) Value inventory
Q14: Which of the following statement about biases
Q22: In the photoelectric effect, the work function
Q29: Data extracted from the accounting information system
Q48: Atoms of an element that have different
Q100: Which of the following statements is false?<br>A)
Q108: What is the opportunity cost of making
Q122: Which graph shows data that are more
Q131: In a normal costing system, the overhead