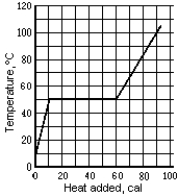
 The graph shows the temperature of a 1.0-g sample of material as heat is added to it. The material is initially a solid at 10°C. The pressure remains constant, and there is no chemical change. The melting point temperature is
Definitions:
Q13: The magnitude of the electric field in
Q20: Halley's Comet returns to the vicinity of
Q22: The energy of a simple harmonic oscillator
Q37: <img src="https://d2lvgg3v3hfg70.cloudfront.net/TB7291/.jpg" alt=" Two identical beakers
Q70: A mass on a spring oscillates with
Q72: Newton's law of gravity is F =
Q133: If you were to double the amplitude
Q133: In a Maxwell-Boltzmann distribution function of molecular
Q157: <img src="https://d2lvgg3v3hfg70.cloudfront.net/TB7291/.jpg" alt=" A triangular wave
Q179: Waves of amplitude 1.1 cm and wavelength