Exhibit 14-1 To comply with recent Federal legislation, school districts must study their students' growth as a whole, as well as the achievement of various subgroups of students. Over a 3-day period, students are assessed on their reading achievement, science and math knowledge, and social studies skills and these results are combined into a global "composite" score. To analyze the increase in this global score from the Freshman year to the Sophomore year, the model y = α + β1x1 + β2x2 + e was fit to a sample of student data. (The actual data contained categorical variables for each ethnic subgroup. To simplify the analysis, only the African American / White categorical variable is included here.)
y = growth in composite score (Soph. - Fresh. score)
x1 = last year's composite score
x2 = 1 if a student is African American, 0 if white
x3 = 1 if a student receives free or reduced price lunch (a measure of socio-economic status), 0 if not
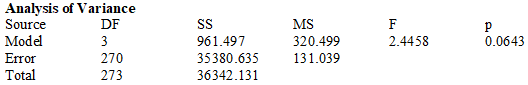
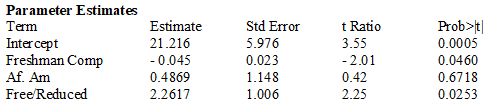
The computer output from the regression analysis is shown below.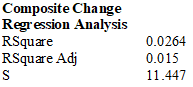
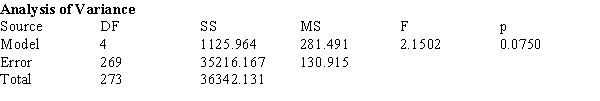
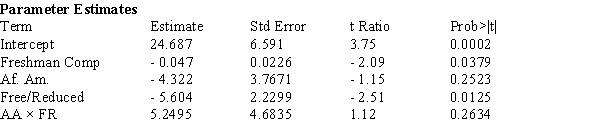
-The data in Exhibit 14-1 were reanalyzed after adding an interaction variable, AAFR, where x4 = x2x3. The computer output is shown below: 
a) Is the Model Utility test significant at the .10 level? Explain your reasoning, referring to specific information in the computer output.
b) Calculate the expected mean growth in composite score for African-American students who scored 280 as Freshmen and are receiving free/reduced lunch.
c) One concern the Federal legislation is intended to address are differences in the school's impact on disadvantaged youngsters. Using the computer output from the interaction model, what, if any, differences in growth scores on the Composite Score from the Freshman to Sophomore year are statistically significant at the .05 level? Does it appear that the different subgroups have different amounts of growth? Justify your reasoning with appropriate references to the data analysis presented in the computer output.
Definitions:
Level 0 Response
The most basic or initial reaction to a stimulus or situation, often without any significant processing or complexity.
Self-disclose
The act of sharing personal information, thoughts, or feelings with others, which can foster trust and facilitate deeper connections.
Marital Status
The legal standing of an individual in terms of marriage, such as single, married, divorced, or widowed.
Empathic Responding
The ability to understand and share the feelings of another, mirroring their emotions in a supportive manner.
Q6: Market-based ratios can be which of the
Q10: The % by weight of the element
Q12: The earnings per share figure _.<br>A) is
Q16: If π = 0.90, a sample size
Q25: An example of a financial middleman is
Q30: Which procedure will set default values for
Q49: Although ratios can provide valuable information, they
Q56: A scatterplot, residual plot, and a boxplot
Q80: You wish to save $500,000 in the
Q86: _ indicate the firm's capacity to meet