Examlex

Solved

You Will Be Asked to Sketch Curves Representing the Distributions

question 8

Essay

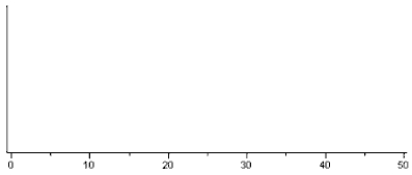
You will be asked to sketch curves representing the distributions of a set of data, as well as the sampling distributions of the mean under different conditions. You need not get these graphs perfectly correct, but should clearly indicate different aspects of the curves, such as location, variability, and shape. The State Fisheries Department wishes to stock the Styx River with fish, and would like the species to not only survive but thrive. (The "substrate" of a river is an important determinant of the quality of spawning habitat.) The pebble diameters in the river are approximately normally distributed with a mean of 24 mm, and a standard deviation of 8 mm. The Fisheries people will select a random sample of pebbles from the Styx River in an attempt to judge the average pebble size.
a) On the scale below, sketch curves representing the distribution of the original population and the sampling distribution of You will be asked to sketch curves representing the distributions of a set of data, as well as the sampling distributions of the mean under different conditions. You need not get these graphs perfectly correct, but should clearly indicate different aspects of the curves, such as location, variability, and shape. The State Fisheries Department wishes to stock the Styx River with fish, and would like the species to not only survive but thrive. (The  substrate  of a river is an important determinant of the quality of spawning habitat.) The pebble diameters in the river are approximately normally distributed with a mean of 24 mm, and a standard deviation of 8 mm. The Fisheries people will select a random sample of pebbles from the Styx River in an attempt to judge the average pebble size.  a) On the scale below, sketch curves representing the distribution of the original population and the sampling distribution of   for a sample of size n = 16.    b) What is the approximate probability that a sample of n = 16 from this population would result in a sample mean greater than 30 mm?  c) Another issue that must be considered in stocking a river with fish is that not only natural predators of the fish, but fishermen and fisherwomen (fisherpersons?) will be taking fish from the river, and thus driving the population down. The graph below is a relative frequency histogram of the lengths of the gentle Hecate fish in the Styx River, as recorded during a massive fish tagging survey. The mean length for these fish was 0.8 feet.   Suppose we were to take a random sample, n = 4, from this population of fish and measure their lengths. Describe the shape, center, and spread of the sampling distribution of   . for a sample of size n = 16. You will be asked to sketch curves representing the distributions of a set of data, as well as the sampling distributions of the mean under different conditions. You need not get these graphs perfectly correct, but should clearly indicate different aspects of the curves, such as location, variability, and shape. The State Fisheries Department wishes to stock the Styx River with fish, and would like the species to not only survive but thrive. (The  substrate  of a river is an important determinant of the quality of spawning habitat.) The pebble diameters in the river are approximately normally distributed with a mean of 24 mm, and a standard deviation of 8 mm. The Fisheries people will select a random sample of pebbles from the Styx River in an attempt to judge the average pebble size.  a) On the scale below, sketch curves representing the distribution of the original population and the sampling distribution of   for a sample of size n = 16.    b) What is the approximate probability that a sample of n = 16 from this population would result in a sample mean greater than 30 mm?  c) Another issue that must be considered in stocking a river with fish is that not only natural predators of the fish, but fishermen and fisherwomen (fisherpersons?) will be taking fish from the river, and thus driving the population down. The graph below is a relative frequency histogram of the lengths of the gentle Hecate fish in the Styx River, as recorded during a massive fish tagging survey. The mean length for these fish was 0.8 feet.   Suppose we were to take a random sample, n = 4, from this population of fish and measure their lengths. Describe the shape, center, and spread of the sampling distribution of   .
b) What is the approximate probability that a sample of n = 16 from this population would result in a sample mean greater than 30 mm?
c) Another issue that must be considered in stocking a river with fish is that not only natural predators of the fish, but fishermen and fisherwomen (fisherpersons?) will be taking fish from the river, and thus driving the population down. The graph below is a relative frequency histogram of the lengths of the gentle Hecate fish in the Styx River, as recorded during a massive fish tagging survey. The mean length for these fish was 0.8 feet. You will be asked to sketch curves representing the distributions of a set of data, as well as the sampling distributions of the mean under different conditions. You need not get these graphs perfectly correct, but should clearly indicate different aspects of the curves, such as location, variability, and shape. The State Fisheries Department wishes to stock the Styx River with fish, and would like the species to not only survive but thrive. (The  substrate  of a river is an important determinant of the quality of spawning habitat.) The pebble diameters in the river are approximately normally distributed with a mean of 24 mm, and a standard deviation of 8 mm. The Fisheries people will select a random sample of pebbles from the Styx River in an attempt to judge the average pebble size.  a) On the scale below, sketch curves representing the distribution of the original population and the sampling distribution of   for a sample of size n = 16.    b) What is the approximate probability that a sample of n = 16 from this population would result in a sample mean greater than 30 mm?  c) Another issue that must be considered in stocking a river with fish is that not only natural predators of the fish, but fishermen and fisherwomen (fisherpersons?) will be taking fish from the river, and thus driving the population down. The graph below is a relative frequency histogram of the lengths of the gentle Hecate fish in the Styx River, as recorded during a massive fish tagging survey. The mean length for these fish was 0.8 feet.   Suppose we were to take a random sample, n = 4, from this population of fish and measure their lengths. Describe the shape, center, and spread of the sampling distribution of   . Suppose we were to take a random sample, n = 4, from this population of fish and measure their lengths. Describe the shape, center, and spread of the sampling distribution of You will be asked to sketch curves representing the distributions of a set of data, as well as the sampling distributions of the mean under different conditions. You need not get these graphs perfectly correct, but should clearly indicate different aspects of the curves, such as location, variability, and shape. The State Fisheries Department wishes to stock the Styx River with fish, and would like the species to not only survive but thrive. (The  substrate  of a river is an important determinant of the quality of spawning habitat.) The pebble diameters in the river are approximately normally distributed with a mean of 24 mm, and a standard deviation of 8 mm. The Fisheries people will select a random sample of pebbles from the Styx River in an attempt to judge the average pebble size.  a) On the scale below, sketch curves representing the distribution of the original population and the sampling distribution of   for a sample of size n = 16.    b) What is the approximate probability that a sample of n = 16 from this population would result in a sample mean greater than 30 mm?  c) Another issue that must be considered in stocking a river with fish is that not only natural predators of the fish, but fishermen and fisherwomen (fisherpersons?) will be taking fish from the river, and thus driving the population down. The graph below is a relative frequency histogram of the lengths of the gentle Hecate fish in the Styx River, as recorded during a massive fish tagging survey. The mean length for these fish was 0.8 feet.   Suppose we were to take a random sample, n = 4, from this population of fish and measure their lengths. Describe the shape, center, and spread of the sampling distribution of   . .


Definitions:

Need-Payoff Question

A question asked by a salesperson to help a potential customer realize the value and benefits of a product, leading to their own conclusion that the product can satisfy their needs.

SPIN Approach

A sales technique that involves asking Situation, Problem, Implication, and Need-payoff questions to understand customer needs and offer solutions.

Rechargeable Batteries

Batteries that can be restored to full charge by applying electrical energy, often used in various electronic devices.

SPIN Approach

stands for Situation, Problem, Implication, and Need-Payoff, a consultative selling technique that focuses on asking the right questions to understand and address customer needs effectively.

Related Questions