In order to attribute changes in nest activity to the active influence of the queen, 9 nests were randomly selected for experimental treatment. The normal activity of the nests were measured, and treatments were administered as described below: 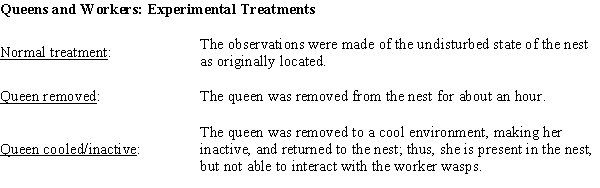 The data for the control treatment and each of the experimental treatments is given in the table below. The Activity Levels are the average proportion of active nest time for workers who were present in the normal and two experimental treatment periods. For example, 0.50 would mean for that nest the average amount of time the workers were actively working was 0.50 of the available time during that treatment. (The colony numbers are for identification in the table only.)
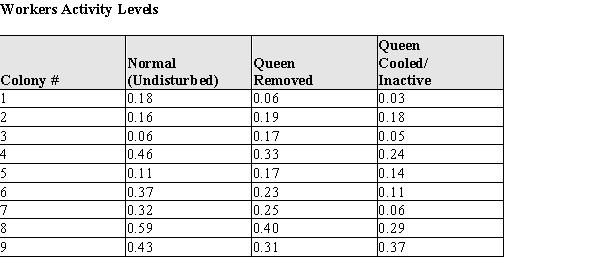
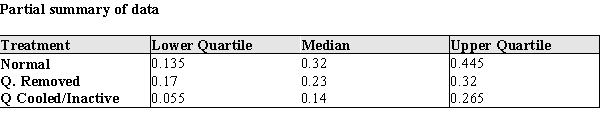
(a) Construct comparative box plots of the active nest times for (a) normal, (b) Queen removed, and (c) Queen Cooled/Inactive. (Note: since the data are proportions, there are no actual units for the data.)
(b) Two current theories about the queen's interaction with workers are that (A) the queen increases worker activity by her mere presence, or (B) she increases worker activity by interacting with worker bees. Based on your plot in part (a), which theory--if either--is supported by the data? Justify your conclusion with an appropriate statistical argument.
(c) What are the mean and standard deviation of the proportion of worker activity for undisturbed wasp nests.  = s =
= s =
(d) One of the nests (Colony #4) has a proportion of worker activity of 0.46. How many standard deviations above/below the mean is the worker activity level in this nest?
(e) The biologists would like to provide some explanatory information for other scientists who would be using their new scale. They would like to state something like the following:
I. "Approximately _____ % of the undisturbed activity levels will be between −2σ and 2σ." OR
II. "At least _____ % of the undisturbed activity levels will be between −2σ and 2σ."
Based on your work so far, would you recommend using the Empirical Rule or Chebyshev's Rule to establish this percentage? Explain your reasoning in a few sentences.
(f) Using your recommended procedure from part (e) what percentage should be used to fill in the blank in the appropriate statement?
Definitions:
Metabolic Rate
The rate at which the body uses energy to support its basic functions and physical activity.
Body Alignment
The proper positioning of body parts relative to each other to maintain correct posture and avoid strain.
Spinal Curves
The natural curvatures in the spine’s alignment, including the cervical, thoracic, lumbar, and sacral regions, that aid in the body's balance and ability to absorb shock.
Posteriorly
Located towards the back or rear of a structure or the body.
Q3: The owner of a stationary and office
Q5: An article proving effectiveness of a new
Q9: What control causes a binding navigator toolbar
Q23: The distribution of <img src="https://d2lvgg3v3hfg70.cloudfront.net/TB7678/.jpg" alt="The distribution
Q26: A modal form cannot lose the focus
Q26: You will be asked to sketch curves
Q32: When children and adolescents are discharged from
Q38: A study is an observational study if
Q58: Financial decisions should be consistent with the
Q79: The following statement can be used to