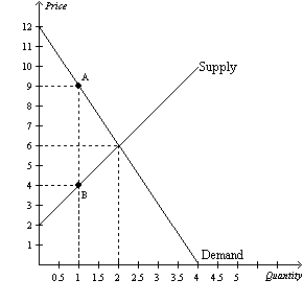
Figure 8-2
The vertical distance between points A and B represents a tax in the market. 
-Refer to Figure 8-2.The amount of deadweight loss as a result of the tax is
Definitions:
Roth IRA
A retirement savings account allowing individuals to contribute after-tax income, with tax-free withdrawals on both contributions and earnings after age 59½.
Traditional IRA
A Traditional IRA is a type of retirement account that allows individuals to direct pre-tax income toward investments that can grow tax-deferred until withdrawals begin at retirement age.
Deferred Annuity
A financial product that offers a stream of payments to the holder, typically starting at a future date, after an initial investment period.
Active Portfolio
In the context of the Treynor-Black model, the portfolio formed by mixing analyzed stocks of perceived nonzero alpha values. This portfolio is ultimately mixed with the passive market-index portfolio.
Q40: The benefit to sellers of participating in
Q44: Refer to Figure 8-1. Suppose the government
Q104: Refer to Figure 8-16. Panel (a) and
Q228: Refer to Figure 8-3. Which of the
Q288: Economists use the government's tax revenue to
Q323: The deadweight loss from a $3 tax
Q363: Refer to Figure 8-5. The total surplus
Q385: Refer to Figure 8-6. When the tax
Q425: Refer to Figure 8-26. Suppose the government
Q442: Refer to Figure 9-19. With free trade,