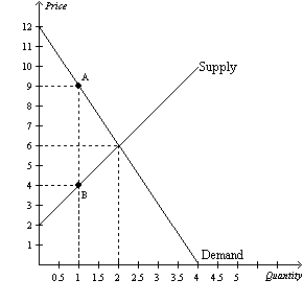
Figure 8-2
The vertical distance between points A and B represents a tax in the market. 
-Refer to Figure 8-2.Total surplus without the tax is
Definitions:
Sum-Of-The-Years-Digits
A depreciation method that results in a more accelerated write-off of the asset, calculated by adding together the digits of the asset's useful life years.
MACRS Tables
The Modified Accelerated Cost Recovery System tables used in the United States for tax purposes to determine the depreciation of assets over time.
Allowable Depreciation
The allowable tax deduction for the reduction in value of a tangible asset over its useful life, as determined by tax regulations.
MACRS Tables
Depreciation schedules in the Modified Accelerated Cost Recovery System allowing for faster asset depreciation in the earlier years of the asset's life.
Q71: The Laffer curve relates<br>A)the tax rate to
Q143: When the government places a tax on
Q149: Producer surplus is the cost of production
Q182: To fully understand how taxes affect economic
Q246: Joel has a 1966 Mustang, which he
Q306: Consumer surplus equals the<br>A)value to buyers minus
Q348: When a tax is imposed on a
Q355: Refer to Figure 9-20. From the figure
Q392: Refer to Figure 8-6. The amount of
Q490: Refer to figure 9-26. After the opening