Figure 4-27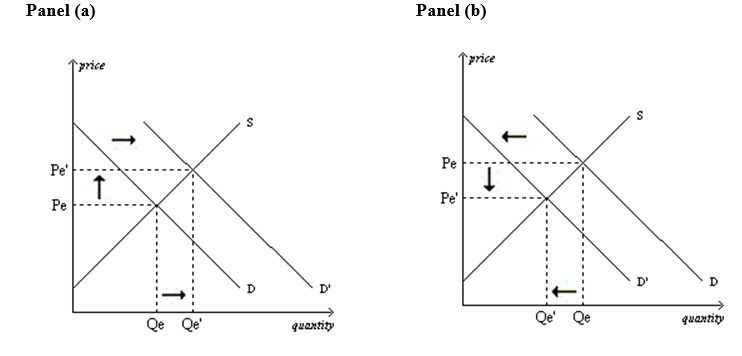
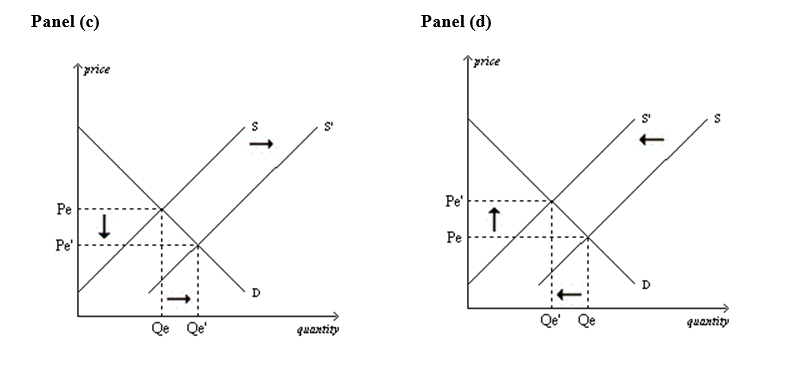
-Refer to Figure 4-27.Which of the four panels illustrates a decrease in quantity demanded?
Definitions:
Perfectly Competitive Industry
A market structure characterized by many buyers and sellers, free entry and exit, homogeneous products, and perfect information, leading to price takers on both the supply and demand sides.
Demand Curve
A graph showing the relationship between the price of a good or service and the quantity demanded for it at various prices.
Perfectly Elastic
A state of demand or supply in which the quantity demanded or supplied changes infinitely with any change in price.
Supply Curve
A graphical representation showing the relationship between the price of a good and the quantity of that good that suppliers are willing to produce and sell.
Q206: Fred trades 2 tomatoes to Barney in
Q212: Assume that a 4 percent decrease in
Q260: Refer to Figure 5-4. Assume the section
Q263: Fill in the table below, showing whether
Q314: If Miguel expects to earn a higher
Q368: A monopoly is a market with one<br>A)seller,
Q395: If consumers often purchase muffins to eat
Q403: A competitive market is one in which
Q419: If mayonnaise and Miracle Whip are substitutes,
Q666: Suppose that a decrease in the price