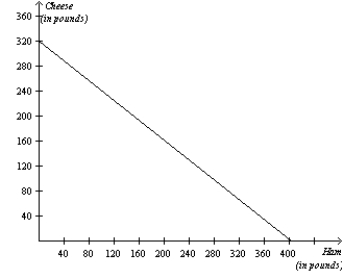
Figure 3-11
The graph below represents the various combinations of ham and cheese (in pounds) that the nation of Bonovia could produce in a given month. 
-Refer to Figure 3-11. If the production possibilities frontier shown is for 240 hours of production, then how long does it take Bonovia to make one pound of cheese?
Definitions:
Horizontal Axis
In a graph or chart, the x-axis running horizontally, typically used to represent the independent variable or the base of comparison.
Vertical Axis
In a graph, the vertical line, usually representing the dependent variable or the measure of outcome.
Corn Chips
A snack food made from cornmeal fried or baked in oil, often seasoned.
French Fries
Sliced potatoes that are deep-fried and typically served as a side dish or snack.
Q69: For both parties to gain from trade,
Q84: Refer to Table 3-38. Iowa and Nebraska
Q183: Economists view positive statements as<br>A)affirmative, justifying existing
Q196: In the circular-flow diagram, which of the
Q337: Which of the following statements is correct?<br>A)Few
Q364: Refer to Figure 3-21. Azerbaijan has an
Q433: While the production possibilities frontier is a
Q479: Refer to Figure 3-5. If Hosne must
Q488: Unemployment causes production levels to be inefficient.
Q502: John Maynard Keynes described economics as an