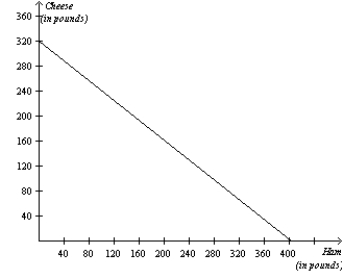
Figure 3-11
The graph below represents the various combinations of ham and cheese (in pounds) that the nation of Bonovia could produce in a given month. 
-Refer to Figure 3-11. If the production possibilities frontier shown is for 240 hours of production, then which of the following combinations of ham and cheese could Bonovia not produce in 240 hours?
Definitions:
Control Limits
Predefined boundaries in a process that signal when it may be out of control, used in quality control frameworks.
Acceptance Sampling Plan
An Acceptance Sampling Plan is a statistical method used to determine whether to accept or reject a batch of products based on a sample, aiming to ensure quality control.
Good Lots
Batches of products that meet quality standards and are deemed acceptable for sale or use.
Bad Lots
Refers to batches of products that fail to meet quality standards or specifications.
Q14: When studying the effects of public policy
Q178: Refer to Table 3-22. Zimbabwe has an
Q183: When describing the opportunity cost of two
Q270: Unless two people who are producing two
Q303: "Ensuring that Social Security is financially sound
Q418: Refer to Table 3-13. The number of
Q468: To produce 100 bushels of wheat, Farmer
Q482: Refer to Figure 2-2. If the flow
Q527: Refer to Figure 2-18. A movement from
Q559: Positive statements are descriptive, while normative statements