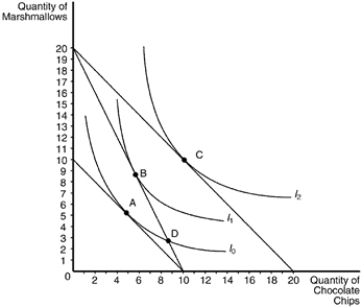
Figure 21-20 The Following Graph Illustrates a Representative Consumer's Preferences for Marshmallows
Figure 21-20
The following graph illustrates a representative consumer's preferences for marshmallows and chocolate chip cookies: 
-Refer to Figure 21-20. Assume that the consumer depicted the figure has an income of $50. Based on the information available in the graph, which of the following price-quantity combinations would be on her demand curve for chocolate chips if the price of marshmallows is $2.50?
Definitions:
Cultural Distance
Refers to the difference in cultural values and beliefs between countries or societies, affecting international business operations and interactions.
Impedes Communication
Hinders or obstructs the effective exchange of information between individuals or groups.
Gen Y
Also known as Millennials, a demographic cohort following Generation X and characterized by their birth years from the early 1980s to the late 1990s.
Rapid Career Growth
Refers to the swift advancement or progression in one's professional life, often marked by promotions, increased responsibilities, and skill development.
Q9: Refer to Figure 21-24. At his optimum,
Q96: Which of the following does not represent
Q308: The field of behavioral economics builds a
Q330: A typical consumer consumes both coffee and
Q334: Insurance companies charge annual premiums to collect
Q349: Which of the following is not correct?<br>A)Economics
Q352: The substitution effect of an increase in
Q420: Thomas faces prices of $6 for a
Q458: The slope at any point on an
Q489: Refer to Figure 21-13. As the consumer