Figure 21-15 On the graph, Qx represents the quantity of good x and Qy represents the quantity of good y. The lines drawn on the graph represent three of Barbara's indifference curves. 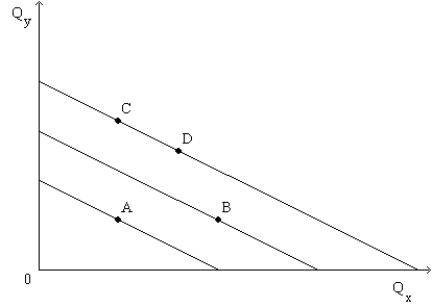
-Refer to Figure 21-15. Barbara is happier at
Definitions:
Ultimatum Game
A game in experimental economics in which two players decide how to divide a sum of money; the first player proposes a division, and the second player can accept or reject it, where rejection means neither player receives anything.
Neoclassical Economics
A framework in economics focusing on the determination of goods, outputs, and income distributions in markets through supply and demand, emphasizing rationality and marginal utility.
Sense of Fairness
An individual's perception of the balance and justice in social interactions and distribution of resources.
Dictator Game
A behavioral experiment that tests how fairly individuals act towards others when given the unilateral power to determine the distribution of a resource.
Q27: The 2011 U.S. distribution of income shows
Q204: The theory of consumer choice<br>A)underlies the concept
Q223: If an indifference curve is bowed in
Q253: The poverty rate is<br>A)a measure of income
Q314: Refer to Figure 21-32. From the figure
Q324: Janet prefers cashews to almonds. She prefers
Q328: A consumer consumes two normal goods, coffee
Q354: Refer to Figure 21-12. Which of the
Q473: Refer to Scenario 20-8. A family earning
Q512: When two goods are perfect substitutes, the