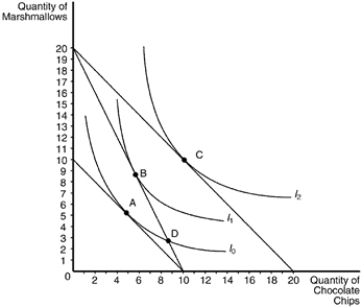
Figure 21-20 The Following Graph Illustrates a Representative Consumer's Preferences for Marshmallows
Figure 21-20
The following graph illustrates a representative consumer's preferences for marshmallows and chocolate chip cookies: 
-Refer to Figure 21-20. Assume that the consumer depicted the figure has an income of $50. Based on the information available in the graph, which of the following price-quantity combinations would be on her demand curve for chocolate chips if the price of marshmallows is $2.50?
Definitions:
Q27: Which of the following events best exemplifies
Q83: Which of the following is an example
Q103: If income increases and prices are unchanged,
Q115: Which of the following practices would indicate
Q158: When the indifference curve is tangent to
Q245: Which of the following best describes why
Q351: Majority rule will produce the outcome most
Q380: Assume that a consumer's indifference curve is
Q472: Which of the following is not a
Q516: When the price of an inferior good