Table 14-2
The table represents a demand curve faced by a firm in a competitive market. 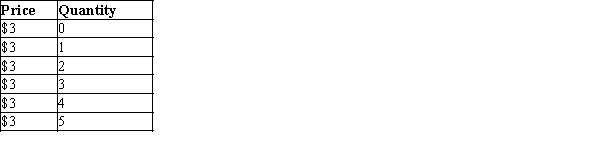
-Refer to Table 14-2. For this firm, the average revenue from selling 3 units is
Definitions:
Shutdown Point
The level of operations at which a company or business does not generate enough revenue to cover its variable costs, leading to a temporary or permanent closure.
AVC (Average Variable Cost)
The total variable costs (costs that vary with the level of output) divided by the quantity of output produced, representing the variable cost per unit.
MC (Marginal Cost)
The rise in overall expenses associated with the production of an extra unit of a product or service.
Break-Even Point
The level of production or sales at which total revenues equal total costs, resulting in no profit or loss.
Q21: A popular resort restaurant will maximize profits
Q76: Bubba is a shrimp fisherman who can
Q102: Firms operating in competitive markets produce output
Q224: Refer to Table 13-10. The average total
Q412: Variable cost divided by quantity produced is<br>A)average
Q427: Refer to Table 13-14. What is the
Q437: When average cost is greater than marginal
Q521: Which of the following firms is the
Q532: If a firm produces nothing, which of
Q644: Refer to Table 13-7. What is the