Multiple Choice
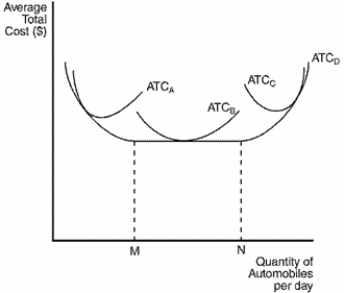
Figure 13-9
The figure below depicts average total cost functions for a firm that produces automobiles. 
-Refer to Figure 13-9. In the long run, the firm can operate on which of the following average total cost curves?
Definitions:
Related Questions
Q37: The Three Amigo's company produced and sold
Q115: When adding another unit of labor leads
Q198: Diminishing marginal product exists when the total
Q241: Refer to Scenario 14-2. To maximize its
Q293: Implicit costs<br>A)do not require an outlay of
Q294: Refer to Table 13-5. The marginal product
Q333: Which of the following is an example
Q454: An example of an explicit cost of
Q457: Refer to Figure 14-1. If the market
Q632: Average variable cost will decrease if _.