Figure 1
b.
Figure 2
c.
Figure 3
d.
Figure 4
ANSWER:
d
DIFFICULTY:
Moderate
LEARNING OBJECTIVES:
ECON.MANK.174 - Given a graph of the production function and input costs, derive the firm's total-cost curve.
TOPICS:
Producer theory
Production function
KEYWORDS:
BLOOM'S: Comprehension
CUSTOM ID:
178.13.3 - MC - MANK08
Figure 13-8 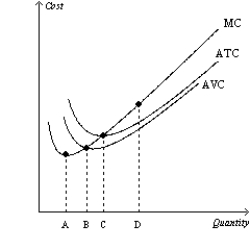
-Refer to Figure 13-8. Quantity B represents the output level where the firm
Definitions:
Q12: Refer to Figure 13-5. Which curve is
Q44: Economies of scale occur when a firm's<br>A)marginal
Q56: Corporate income taxes are based on the
Q289: When marginal cost exceeds average total cost,<br>A)average
Q359: Refer to Table 14-4. For this firm,
Q383: The U.S. federal government collects about one-half
Q465: The amount of money that a wheat
Q477: A payroll tax is also referred to
Q537: If a firm produces nothing, it still
Q546: Pete owns a shoe-shine business. Which of